← Back to Projects Machine Learning & Time Series Forecasting with Interactive Data Visualization
Train, compare, serve, and visualize machine-learning models through REST APIs, persistent data flows, and an interactive application dashboard.
Categories
ML
Tech Used
Unsupervised Learningscikit-learnXGBoostLSTMsForecasting ModelsFine-tuningTensorFlowPyTorchpandasNumPyFastAPIFlaskREST APIsMatplotlib/SeabornHTMLCSSJavaScriptPostgreSQLDocker
Problem
Machine-learning models are most useful when predictions can be served reliably, compared clearly, and reviewed through an interface accessible to non-technical stakeholders.
Approach
- Trained and compared multiple machine-learning and deep-learning model families for prediction tasks
- Built REST API endpoints for online and batch inference workflows
- Connected models with persistent data and application-level prediction pipelines
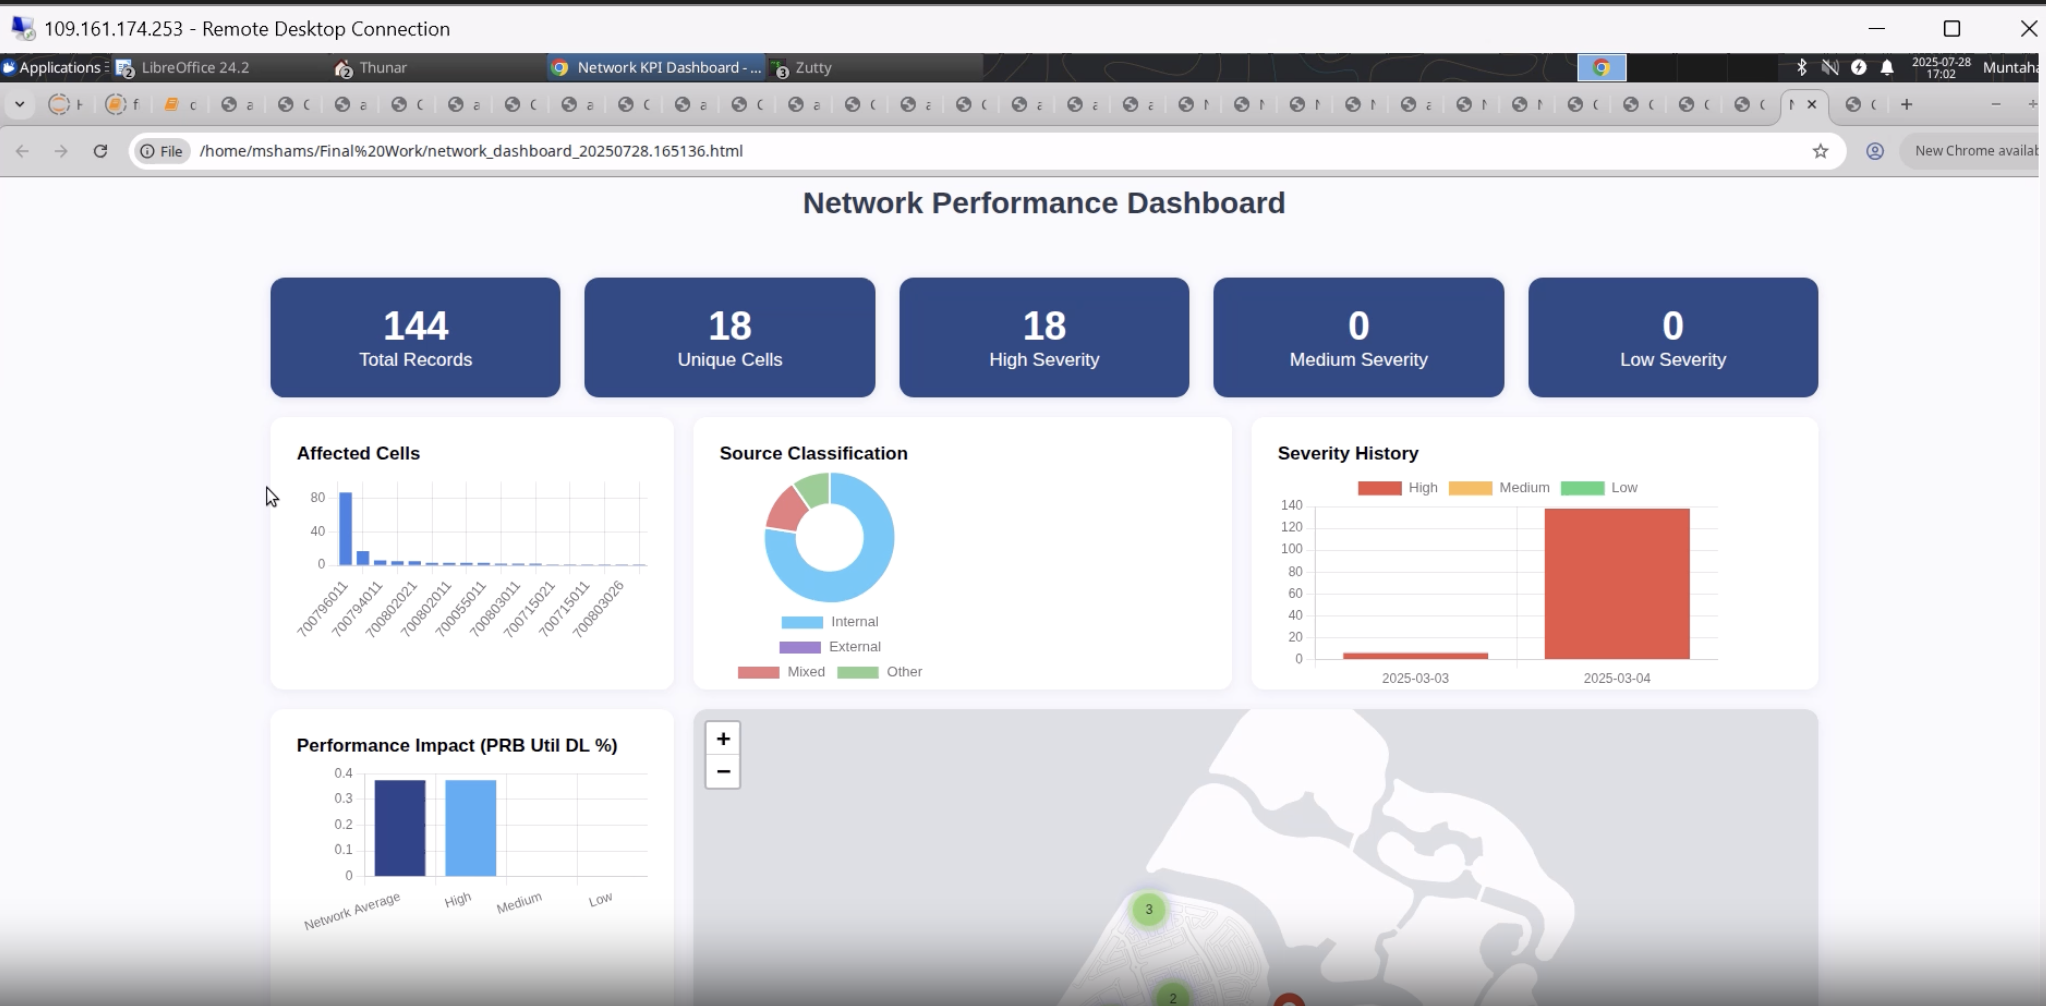
- Created dashboard views for predictions, evaluation metrics, and model-facing interaction
Results
- Delivered an end-to-end workflow from model development to API-based prediction and visualization
- Created a reusable architecture for production-style ML applications and proof-of-concept platforms
- Made model outputs easier for non-technical stakeholders to inspect and compare
Demo Videos